Use this estimated average glucose calculator to convert HbA1c to eAG in mmol/L and mg/dL, reverse eAG to approximate A1c, and compare the result with IFCC.
Health estimate
Editorial responsibility: Calcipedia editorial team
This page is maintained against the site trust model for its topic and updated when formulas, sources, or guidance materially change.
Estimated average glucose from HbA1c Convert a lab HbA1c result into eAG in mmol/L and mg/dL, or reverse an average glucose value into an approximate A1c for a clinical conversation.
Quick examples
Input
Convert HbA1c and eAG
Use HbA1c when you have a lab percentage, or eAG when you are comparing a meter log, glucose report, or CGM average with an A1c-style estimate.
Direction
Enter values Enter a valid A1c or eAG value to see estimated average glucose.
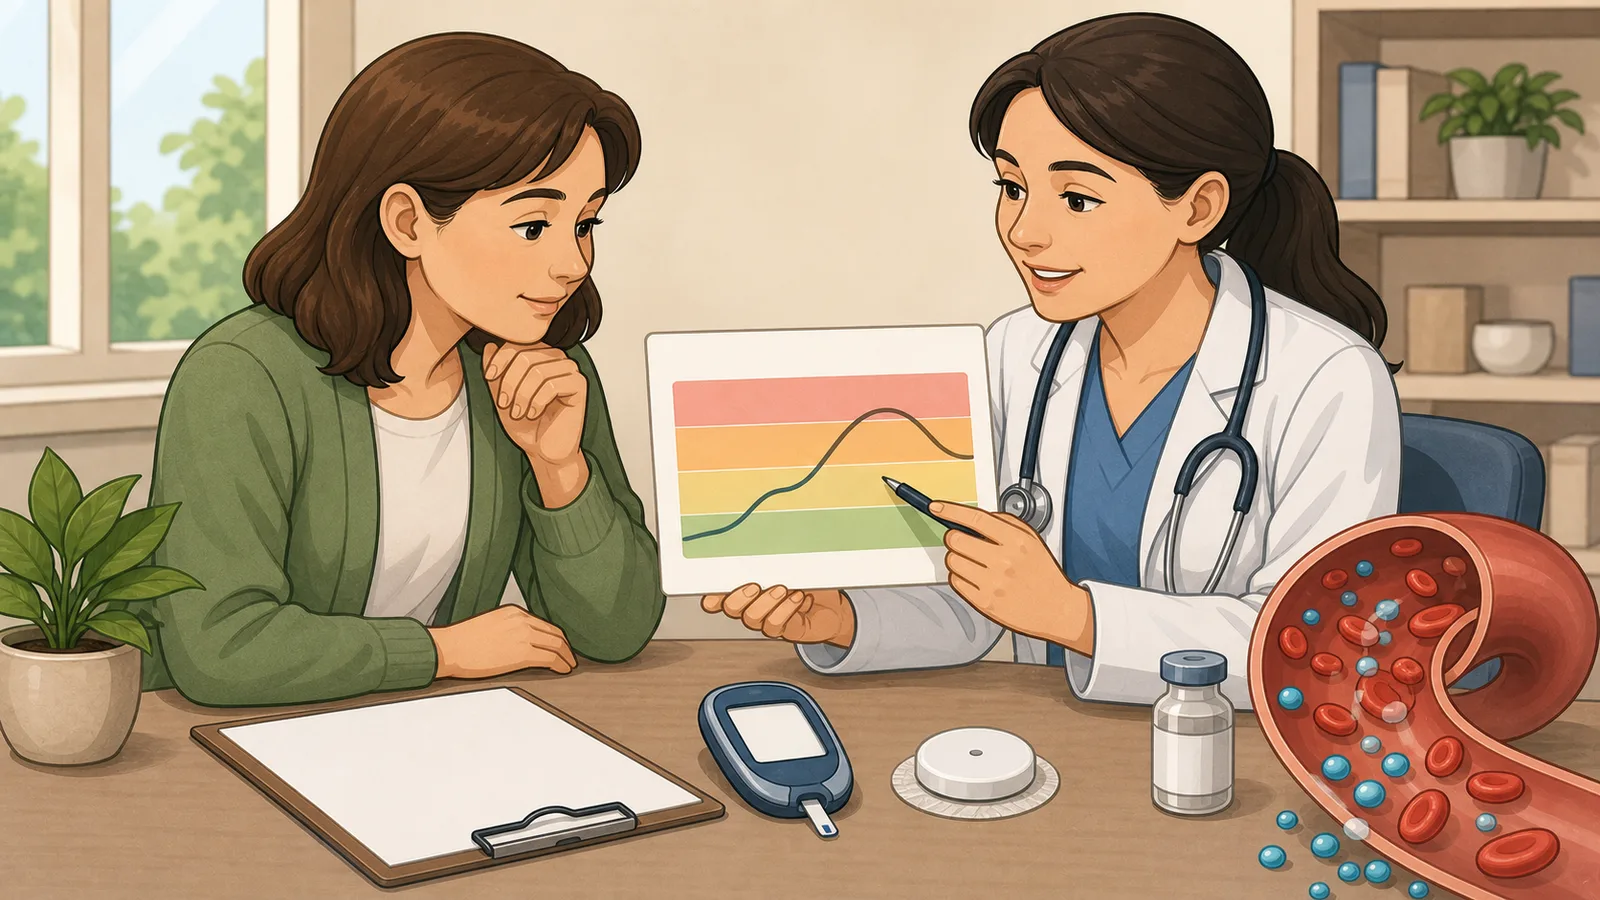
Estimated average glucose calculator guide: HbA1c to eAG in mmol/L and mg/dL
HbA1c is reported as a percentage, which is clinically useful but abstract for many people. This estimated average glucose calculator translates A1c into eAG in the same mmol/L and mg/dL units used by glucose meters, CGM reports, and blood sugar logs, and it can reverse an eAG value into an approximate HbA1c.
Why eAG was introduced
The ADA introduced eAG reporting to help bridge the gap between the A1c percentage that clinicians monitor and the mmol/L or mg/dL values that people with diabetes see on meters and sensor reports every day. An A1c of 7% corresponds to an eAG of approximately 8.6 mmol/L (154 mg/dL), which feels more concrete when compared with daily readings.
The ADAG (A1c-Derived Average Glucose) study validated the relationship using continuous glucose monitoring and frequent finger-stick glucose data across a diverse population with and without diabetes. The resulting linear formula provides a reasonable population estimate, though individual variation of up to about ±0.5–1.5 mmol/L (10–30 mg/dL) is documented.
How to use the estimated average glucose calculator
Choose A1c to eAG when you have a lab HbA1c percentage and want to see the estimated average blood sugar behind it. The calculator shows both mmol/L and mg/dL so you can compare the result with whichever unit appears on your meter, CGM app, or clinical notes.
Choose eAG to A1c when you already know an average glucose value, such as a meter-log average or a CGM summary, and want an approximate A1c-equivalent. This reverse conversion is useful for orientation, but it is not a substitute for a laboratory HbA1c test.
The ADAG formula
For A1c to eAG, the standard ADAG equation is eAG (mg/dL) = 28.7 × HbA1c% − 46.7. The mmol/L version is eAG (mmol/L) = 1.5944 × HbA1c% − 2.5944. The reverse equation is HbA1c% = (eAG mg/dL + 46.7) ÷ 28.7.
The calculator also shows the IFCC mmol/mol equivalent because some laboratory reports use IFCC units instead of percent. That is a unit translation of the same HbA1c result, not a separate glucose reading.
eAG (mg/dL) = 28.7 × HbA1c% − 46.7
This is the ADAG equation used to convert HbA1c into estimated average glucose.
HbA1c% = (eAG mg/dL + 46.7) ÷ 28.7
This reverses the ADAG equation when an average glucose value is entered.
IFCC HbA1c (mmol/mol) = (HbA1c% − 2.15) × 10.929
This converts an NGSP/DCCT-aligned HbA1c percentage into IFCC mmol/mol units.
Worked example: converting a lab HbA1c
If a lab report shows an HbA1c of 7.0%, the ADAG formula converts that to an estimated average glucose of about 8.6 mmol/L or 154 mg/dL. That helps explain how fasting readings in the 6-7 mmol/L range can still fit an overall average that is higher once post-meal rises and overnight values are included.
The reverse direction gives the same context from the other side. If a CGM or glucose log average is about 154 mg/dL, the equation estimates an HbA1c close to 7.0%. The eventual lab A1c can still differ because red blood cell biology and the measurement window are different.
eAG versus daily readings
eAG represents an average across all times of day, including fasting periods, post-meal peaks, overnight readings, and values that are never captured by occasional finger-stick checks. It will therefore often be higher than a pre-breakfast fasting reading on a home meter.
A person with an A1c of 7% (eAG 8.6 mmol/L or 154 mg/dL) might see fasting readings of 6–7 mmol/L and post-meal readings of 9–11 mmol/L, both consistent with that average. The average does not reveal whether glucose was steady, highly variable, or affected by frequent lows and highs.
Why eAG, CGM average glucose, and GMI can differ
A CGM average is measured directly from sensor readings over the period the sensor was worn. eAG is inferred from HbA1c, which reflects glycation over roughly 2-3 months and is weighted more heavily toward recent weeks. Glucose management indicator (GMI) is another formula-based estimate from CGM data, not the same laboratory measurement as HbA1c.
This is why two numbers can be close without matching exactly. When A1c-derived eAG and CGM average glucose disagree, the mismatch can be clinically useful because it may point to glucose variability, sensor-period differences, or conditions that make HbA1c less reliable.
When A1c may not reflect average glucose well
HbA1c depends on red blood cell lifespan and haemoglobin glycation. Anaemia, haemolysis, haemoglobin variants, recent blood transfusion, pregnancy, advanced kidney disease, and some other conditions can make A1c higher or lower than expected for the true average glucose.
If your eAG estimate does not match your home readings or CGM report, do not assume either number is simply wrong. Bring the pattern to a qualified clinician, especially if treatment decisions, symptoms, pregnancy, kidney disease, or repeated hypoglycaemia are involved.
Frequently asked questions
What is estimated average glucose?
Estimated average glucose, or eAG, is a formula-based estimate of average blood glucose derived from HbA1c. It translates an A1c percentage into mmol/L or mg/dL so the result can be compared with meter and CGM units.
How do I convert A1c to eAG?
Use the ADAG formula: eAG in mg/dL = 28.7 × HbA1c% − 46.7. To show eAG in mmol/L, use eAG = 1.5944 × HbA1c% − 2.5944, or divide the mg/dL result by about 18.
Can I convert eAG back to A1c?
Yes, as an estimate. Use HbA1c% = (eAG mg/dL + 46.7) ÷ 28.7. This reverse eAG to A1c conversion is useful for orientation, but a laboratory HbA1c test is still needed for clinical interpretation.
Is eAG the same as average glucose on a CGM?
Not exactly. CGM average glucose is a direct measurement average from sensor readings over days or weeks. eAG is a formula estimate derived from A1c over roughly 2-3 months. Both reflect average glucose, but they are calculated differently and can disagree.
Why does my eAG seem higher than my typical meter readings?
Home meters are often used for fasting or specific test times before meals or bedtime. eAG includes post-meal peaks and unmeasured periods, so an all-day average can be higher than fasting-focused self-monitoring suggests.
What is an eAG of 154 mg/dL in A1c?
An eAG around 154 mg/dL converts to an HbA1c of about 7.0% using the ADAG reverse equation. In mmol/L, 154 mg/dL is about 8.6 mmol/L.
Can this estimated average glucose calculator diagnose diabetes?
No. The calculator translates between HbA1c and estimated average glucose, but diagnosis and treatment targets depend on clinical context, confirmatory testing, symptoms, pregnancy status, medication, and other risk factors.
What can make eAG inaccurate?
Anything that makes HbA1c unreliable can make eAG unreliable. Examples include anaemia, haemoglobin variants, haemolysis, recent transfusion, pregnancy, advanced kidney disease, and other conditions that affect red blood cell lifespan.