Skip to content
Calcipedia
Percentile Calculator instructional illustration

Percentile Calculator

Use this percentile calculator to find percentile values from a dataset, compare linear interpolation with nearest rank, view every-fifth cutoffs.

Last updated

Percentile calculator for ranked datasets Find a percentile value such as P25, P50, P90, or P95, compare linear interpolation with nearest-rank output, and calculate the percentile rank of a specific value in the same dataset.

Quick datasets

A compact classroom-style dataset shows how P75 and percentile rank differ.

Result

P75 = 56.5

Based on 7 values sorted from 40 to 65 using linear interpolation.

56.5

P75 value

53

Median (P50)

78.57%

Percentile rank of 59

7

Count

P75 value56.5
Linear interpolation value56.5
Nearest-rank value59
Median (P50)53
Minimum40
Maximum65
Count7

Calculation detail

The inclusive interpolation method places P75 at fractional index 4.5 in the zero-indexed sorted dataset.

Lower neighbour
Position 5: 54
Upper neighbour
Position 6: 59
Interpolation fraction
0.5
Selected method
Linear interpolation
Percentile rank interpretation The value 59 has 5 values below it and 1 equal value in this dataset, so its midrank percentile rank is 78.57%.

Common percentile cutoffs

Use these rows to compare every fifth percentile, quartiles, median, and upper-tail thresholds without rerunning the calculator for each cutoff.

CutoffLinearNearest rank
P0 minimum4040
P540.640
P1041.240
P1541.842
P204342
P25 / Q144.542
P304647
P3547.647
P4049.447
P4551.253
P50 median5353
P5553.353
P6053.654
P6553.954
P705554
P75 / Q356.559
P805859
P8559.659
P9061.465
P9563.265
P100 maximum6565

Sorted dataset

Percentiles depend on order, so the calculator sorts your pasted values before finding the rank position.

40, 42, 47, 53, 54, 59, 65

← All Statistics calculators

Descriptive Statistics

Percentile calculator — find any percentile in your dataset

A percentile calculator helps you find the value at a chosen percentile in a ranked dataset and understand the percentile rank of a specific score or measurement.

How percentiles are calculated

This calculator uses linear interpolation — the same method as Excel's PERCENTILE.INC function and NumPy's default. For percentile P and a sorted dataset of n values, the index is L = (P/100) × (n − 1). If L is a whole number, the result is the value at that index. If L falls between two indices, the result is interpolated: value[floor(L)] + fractional_part × (value[ceil(L)] − value[floor(L)]).

For example, in the dataset [15, 20, 35, 40, 50] with n=5, the 25th percentile index is 0.25 × 4 = 1. The value at index 1 is 20, so P25 = 20. For the 30th percentile: index = 0.30 × 4 = 1.2, so P30 = 20 + 0.2 × (35 − 20) = 23.

The calculator also shows the nearest-rank result beside the interpolated value. Nearest rank chooses an observed value from the sorted dataset, while interpolation can return a value between two observations. Showing both methods makes it easier to reconcile spreadsheet output, classroom formulas, and threshold rules that must use an actual measured value.

Common percentiles

The most frequently used percentiles are the quartiles: P25 (Q1), P50 (median, Q2), and P75 (Q3). The 90th and 95th percentiles are common in performance benchmarking. The 5th and 95th percentiles together define the 90% range. The 99th percentile is used in latency measurements and outlier analysis.

Competitor percentile calculators often stop at one requested cutoff or a small group of quartiles. This calculator now keeps the requested percentile, nearest-rank comparison, percentile rank, and every-fifth-percentile sheet together so you can scan P0, P5, P10, P15, and the rest of the ranked dataset without repeatedly changing the input.

In standardised testing, scores are often reported as percentile ranks. A percentile rank of 85 means the student scored higher than roughly 85% of test takers — not that they got 85% of questions right.

In analytics and engineering, P90, P95, and P99 answer a different question from the average. A P95 page-load time describes the cutoff experienced by most users while reducing the influence of a single extreme maximum. In salary or price benchmarking, P25, P50, and P75 often describe lower-market, median-market, and upper-market values more clearly than one arithmetic mean.

Percentile vs. percentile rank

A percentile value is a number from the dataset (e.g. the 90th percentile score is 720). A percentile rank is a position (e.g. your score of 720 is at the 90th percentile rank). This calculator finds the value at a given percentile position.

Note that the 50th percentile equals the median, and the 0th and 100th percentiles equal the minimum and maximum values respectively.

The live calculator now handles both directions: enter P90 to find the P90 value, or enter a score to estimate its percentile rank inside the dataset. The percentile-rank output uses a midrank convention, which counts values below the target plus half of the tied values. That tie treatment is useful when repeated scores or measurements would otherwise make ranks jump abruptly.

Choosing linear interpolation or nearest rank

Linear interpolation is usually the best default for general descriptive statistics because it changes smoothly as the requested percentile changes. It is also familiar to people comparing results with spreadsheet functions and scientific computing tools. The trade-off is that the answer can be a value that never appeared in the original list.

Nearest rank is better when the cutoff must be an observed value. For example, a policy threshold, sample record, or classroom ranking may need to point to an actual score in the sorted dataset. The trade-off is that nearest-rank percentiles can jump sharply in small datasets, especially at high percentiles such as P90 or P95.

Worked example: P75 and percentile rank

Suppose the sorted dataset is 40, 42, 47, 53, 54, 59, 65 and you want P75. With linear interpolation, the zero-indexed location is 0.75 × (7 − 1) = 4.5. The value is halfway between positions 5 and 6 in one-based terms: 54 and 59. That gives P75 = 56.5. The nearest-rank method instead uses rank ceil(0.75 × 7) = 6, so it returns the observed value 59.

If you ask for the percentile rank of 59 in the same dataset, five values are below 59 and one value equals 59. The midrank rule gives (5 + 0.5 × 1) / 7 × 100 = 78.57%. That is a rank-style statement about where 59 sits in the list, not a value-at-percentile calculation.

When percentiles are useful, and when they are not enough

Percentiles are strongest when the distribution is skewed, contains outliers, or needs a non-average threshold. They help summarize salaries, response times, wait times, sale prices, exam scores, biological measurements, and quality-control data without letting one extreme value dominate the story.

Percentiles do not explain why values differ, and they do not replace domain-specific judgement. A P95 latency result can show that some requests are slow, but it does not identify the technical cause. A percentile rank for a test score can show relative standing, but it does not measure mastery by itself. Pair percentiles with context, sample size, and related statistics such as median, IQR, standard deviation, or z-score when the decision matters.

Frequently asked questions

What is the difference between percentile and percentage?

A percentage is a ratio expressed out of 100 (e.g. 75%). A percentile is a position in a ranked dataset. Scoring 75% on a test means you got 75 of 100 questions right. Being at the 75th percentile means you scored higher than 75% of all test takers — you could achieve this by scoring 60% if most others scored lower.

Why does this differ from other percentile calculators?

There are several methods for computing percentiles (exclusive, inclusive, nearest-rank, etc.). This calculator uses the linear interpolation / inclusive method (Excel PERCENTILE.INC, Python numpy default). Other methods may produce slightly different results, especially for small datasets.

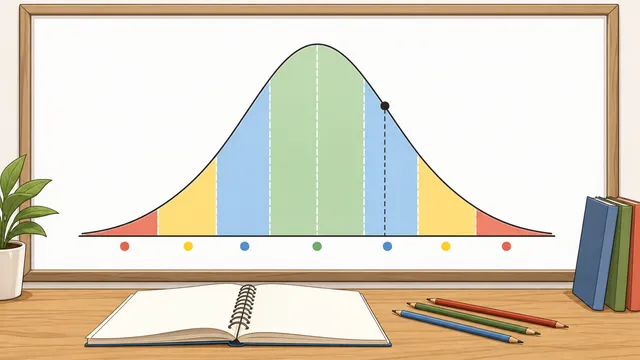
What is the percentile in a normal distribution?

For a normal distribution, percentiles correspond to z-scores. The 50th percentile is the mean (z=0), the 84th percentile is one standard deviation above the mean (z=1), and the 97.7th percentile is two standard deviations above (z=2). Use the normal distribution calculator to find exact percentiles for a given mean and standard deviation.

What does a percentile calculator do?

A percentile calculator sorts your dataset and finds the value at a requested percentile, such as P25, P50, P90, or P95. A stronger percentile calculator also helps with the reverse question: given a value, what percentile rank does that value have within the dataset?

What is the difference between percentile value and percentile rank?

A percentile value answers, “What number is at this percentile?” For example, P90 might be 720. Percentile rank answers, “Where does this specific value sit?” For example, a score of 720 might have a 90th percentile rank. The first returns a cutoff value; the second returns a relative position.

Should I use linear interpolation or nearest rank?

Use linear interpolation when you want smooth, spreadsheet-style percentile estimates for general analysis. Use nearest rank when the percentile result must be one of the observed data values. The difference is most noticeable in small datasets and at tail cutoffs such as P90, P95, and P99.

Why can a percentile be a value that is not in my dataset?

Interpolation estimates a point between two neighboring sorted values when the percentile location is fractional. That is why P75 for a small dataset might be 56.5 even when no entered value is exactly 56.5. Nearest rank avoids this by choosing an observed value, but it produces less smooth cutoffs.

How many values do I need for a meaningful percentile?

A percentile can be calculated from a very small dataset, but small-sample percentiles are unstable. With only a few values, adding or removing one observation can move P90 or P95 dramatically. Use small datasets for learning or quick summaries, and use larger samples before drawing strong conclusions about tails or benchmarks.

What are P25, P50, P75, P90, and P95 used for?

P25, P50, and P75 are the lower quartile, median, and upper quartile. They describe the middle of a distribution and are useful for salaries, prices, and test scores. P90 and P95 are upper-tail cutoffs often used for performance benchmarks, latency targets, high-end compensation, and outlier screening.

Do I need to sort my numbers before using the calculator?

No. The calculator parses your comma-, space-, or line-separated values, sorts the numeric entries internally, and then calculates the percentile or percentile rank from the ordered dataset. The sorted-data display is included so you can check the calculation path.

Why does the calculator reject text mixed into the dataset?

A percentile calculation depends on the exact set of values being ranked. If the calculator silently dropped a token such as "late", "30ms", or a unit label, the result could look precise while using a smaller dataset than you intended. The warning asks you to remove or correct invalid entries so the percentile value, percentile rank, and every-fifth-percentile table all use the same audited list.

Can this calculator handle grouped frequency data?

This calculator is designed for raw numeric lists. Grouped frequency data usually needs a different workflow using cumulative frequencies and interpolation within bins. If you only have bins instead of raw values, do not paste bin labels as though they were individual observations.

Guides

Featured in articles

Step-by-step guides that use this calculator to solve real problems.

Also in Statistics

Related

More from nearby categories

These related calculators come from the same leaf category, nearby sibling categories, or the same top-level topic.