Calculate confidence intervals for means or proportions from sample statistics and confidence level, with z or t mean intervals, margin of error, Wilson checks.
Last updated
Type
Confidence level
Mean interval method
Use z when population σ is known or n is large; use t when the entered standard deviation is from the sample.
Confidence interval sheet
48.04 to 51.96
95% mean interval. This page uses the standard large-sample z-interval for a mean, which is best when the population standard deviation is known or the sample is large enough for the normal approximation.
48.04
Lower bound
51.96
Upper bound
±1.96
Margin of error
Confidence interval
(48.04, 51.96)
Sample mean
50
Sample size
100
Standard error
1
Interval width
3.92
Working formula
50 ± 1.96 × (10 / √100)
Critical z-value
1.96
Confidence-level comparison
Holding the same mean, standard deviation, and sample size constant, higher confidence widens the interval.
Level
Lower
Upper
Margin
Width
Critical value
80%
48.72
51.28
±1.28
2.56
1.28
85%
48.56
51.44
±1.44
2.88
1.44
90%
48.36
51.64
±1.64
3.29
1.64
95%
48.04
51.96
±1.96
3.92
1.96
99%
47.42
52.58
±2.58
5.15
2.58
Precision planning
Holding the sample mean and standard deviation fixed, larger samples shrink the margin of error roughly with the square root of n.
Sample size
Lower
Upper
Margin
Width
100
48.04
51.96
±1.96
3.92
200
48.61
51.39
±1.39
2.77
400
49.02
50.98
±0.98
1.96
Method caution For small samples with an unknown population standard deviation, switch to the t-interval method rather than relying on the z-interval.
Confidence interval — estimating population parameters from sample data
A confidence interval calculator turns sample data into a range of plausible values for an unknown population parameter. This page also explains the main assumptions behind the confidence interval — estimating population parameters from sample data result, highlights the supporting figures shown by the calculator, and helps the reader use the estimate without overstating what a quick online tool can prove.
What this calculator covers
This calculator handles the two most common confidence-interval search intents: a confidence interval for a mean and a confidence interval for a proportion. That means it can be used for poll percentages, survey response rates, pass/fail proportions, and sample averages from a study or experiment.
For mean intervals, the calculator now lets you choose between a z interval and a Student t interval. Use the z interval when the population standard deviation is known or the sample is large enough for a normal approximation. Use the t interval when the entered standard deviation is the sample standard deviation and the population standard deviation is unknown.
If you are looking for a 95% CI calculator, a margin of error calculator, or a way to see how sample size changes interval width, the same three inputs keep showing up in practice: confidence level, variability, and sample size. Bigger samples narrow the interval, while higher confidence widens it.
What a confidence interval means
A 95% confidence interval does not mean there is a 95% probability the true value lies within that specific range. Once an interval is calculated, the true parameter is either inside it or it is not. The correct interpretation is procedural: if you repeated the study many times using the same method, approximately 95% of the resulting intervals would contain the true population parameter.
This distinction matters in practice. Saying "we are 95% confident the mean lies between 48 and 52" is shorthand for a sampling guarantee — the procedure produces correct intervals 95% of the time.
CI for a mean (large-sample z-interval)
For a sample mean, the confidence interval is the sample mean plus or minus the margin of error: x̄ ± z × (σ / √n). The term σ / √n is the standard error — how much sample means vary around the true population mean.
This calculator uses the z-distribution (standard normal), which is appropriate when the sample size is large (typically n ≥ 30) or the population standard deviation is known. For small samples with unknown population standard deviation, a t-distribution should be used instead.
CI = x̄ ± z × (σ / √n)
x̄ is the sample mean, σ is the standard deviation, n is the sample size, z is the critical value.
CI for a mean with a t interval
Competitor confidence interval calculators often separate mean intervals into z and t methods because they answer different classroom and research questions. A z interval assumes the population standard deviation is known or that the sample is large enough for the normal approximation to be a reasonable shorthand. A t interval uses the sample standard deviation and adds uncertainty through degrees of freedom.
The t interval formula is x̄ ± t* × (s / √n), where s is the sample standard deviation, n is the sample size, and t* is the two-sided critical value from Student's t distribution with n − 1 degrees of freedom. The t critical value is wider than the matching z critical value for small samples, then approaches z as n grows.
This is why the method selector appears before the mean inputs. If you enter a small sample and an estimated sample standard deviation, choosing t gives a more honest margin of error than pretending the standard deviation is known exactly.
CI = x̄ ± t* × (s / √n)
Student t confidence interval for a mean when the population standard deviation is unknown.
df = n − 1
Degrees of freedom used for the one-sample t interval.
CI for a proportion (Wald interval)
For a proportion, the standard error is √(p̂(1 − p̂)/n), where p̂ is the observed proportion. This gives CI = p̂ ± z × √(p̂(1 − p̂)/n). The result is expressed as a percentage range around the observed rate.
The Wald interval works well when n is large and p̂ is not too close to 0 or 1. For small samples or extreme proportions, the Wilson score interval is more accurate, but the Wald interval is the standard introductory form.
CI = p̂ ± z × √(p̂(1 − p̂) / n)
p̂ is the sample proportion (successes / n), z is the critical value for the chosen confidence level.
Factors that affect interval width
Three things control the width of a confidence interval: confidence level, sample size, and variability. Higher confidence (e.g. 99% vs 95%) produces wider intervals. Larger samples produce narrower intervals — doubling sample size reduces margin of error by a factor of √2 ≈ 1.41. Greater variability (higher σ or more extreme p̂) also widens the interval.
Narrower intervals are not always better — a very narrow interval at 80% confidence may be less useful than a wider one at 99% confidence, depending on the decision at stake.
Why this page now shows sample-size precision planning
Many confidence-interval searches are really planning questions in disguise. People do not only want the current interval. They want to know how much the interval would tighten if the sample were doubled, tripled, or otherwise expanded. That is why the page now includes precision-planning rows rather than stopping at one finished confidence interval.
The pattern is predictable: margin of error shrinks with the square root of sample size. Doubling n does not cut the interval width in half, and quadrupling n is what usually gets you close to halving the margin. Those planning rows are useful because they convert a general textbook rule into a decision you can use when estimating whether collecting more data is worth the effort.
Why Wilson intervals are often better for proportions
For proportions, the classic Wald interval is the introductory default, but it can behave poorly when the sample is small or the observed rate is close to 0% or 100%. In those cases, the lower bound can become too optimistic or the upper bound can become too wide. A Wilson score interval usually stays better calibrated.
This page still reports the Wald interval because it matches many classroom and introductory-calculator workflows, but it now also shows the Wilson comparison so you can see when the more robust interval starts to diverge. That comparison is especially useful for survey questions with small samples, rare-event rates, or pilot studies where the observed proportion sits near an edge.
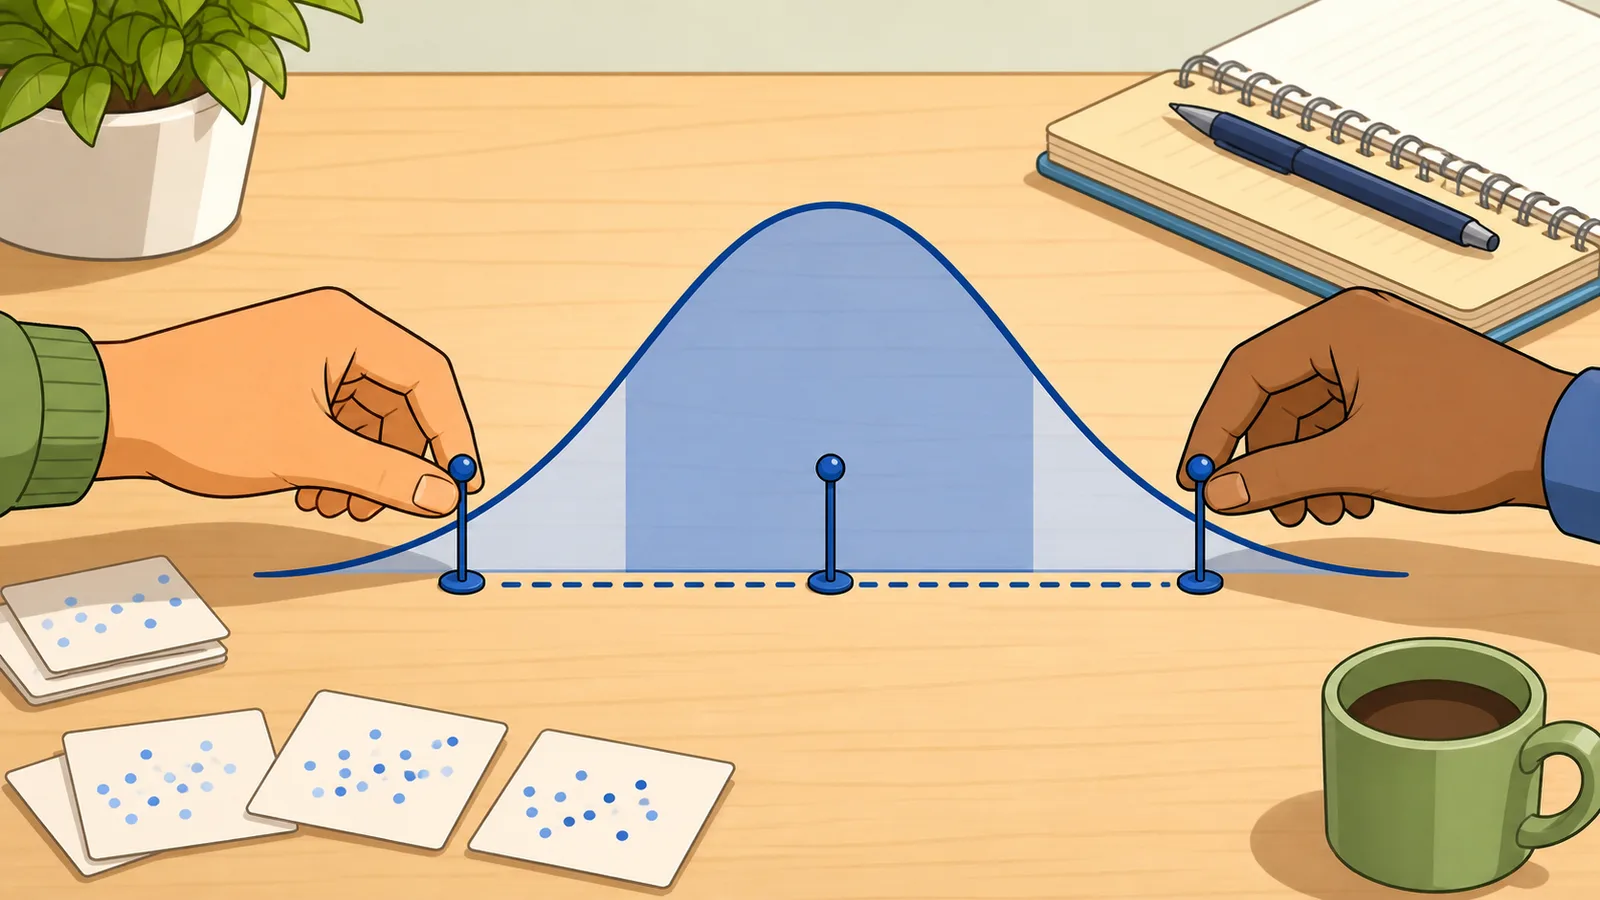
Worked example: a 95% mean interval
Suppose a sample mean is 50, the standard deviation is 10, and the sample size is 100. The standard error is 10 / √100 = 1. At 95% confidence, the z critical value is 1.96, so the margin of error is 1.96 × 1 = 1.96.
That gives a 95% confidence interval of 50 ± 1.96, or from 48.04 to 51.96. If you keep the same sample statistics but raise confidence to 99%, the interval becomes wider because the critical value rises to 2.5758.
Frequently asked questions
When should I use a t-interval instead of a z-interval?
Use a t-interval when estimating a mean and the population standard deviation is unknown, especially when the sample is small. The t-distribution has heavier tails than the normal distribution, producing wider intervals to account for additional uncertainty in the sample standard deviation. As n grows, the t-distribution approaches the z-distribution, so for large samples the difference becomes smaller.
What is the difference between a z confidence interval and a t confidence interval?
A z confidence interval uses a normal critical value and is best when the population standard deviation is known or the sample is large enough for a normal approximation. A t confidence interval uses a Student t critical value with n − 1 degrees of freedom and is better when the standard deviation was estimated from the sample. For small samples, the t interval is wider because it accounts for extra uncertainty.
What does "95% confidence" actually mean?
95% confidence refers to the long-run reliability of the procedure: if you collected 100 independent samples and computed a 95% CI for each, about 95 of those intervals would contain the true population parameter. It does not mean the true value has a 95% chance of being inside any specific calculated interval.
Can a confidence interval contain negative values for a proportion?
Mathematically, the Wald formula can produce bounds below 0% or above 100% for extreme proportions or small samples. This calculator clamps results to [0%, 100%] to keep them interpretable, but the clamping is a sign that the Wald interval is not ideal for those inputs. The Wilson score interval handles extreme cases more gracefully.
How is margin of error related to confidence interval?
The margin of error is half the width of the confidence interval. If a poll reports 60% ± 3%, the confidence interval is (57%, 63%) and the margin of error is 3 percentage points. Margin of error and confidence interval are two ways of expressing the same information.
Why does a higher confidence level make the interval wider?
Because you are asking for a range that captures the true parameter more often in repeated sampling. To achieve that higher capture rate, the critical value increases, which pushes the lower bound down and the upper bound up.
What is the difference between a mean interval and a proportion interval?
A mean interval estimates an average value, such as average height or average spend. A proportion interval estimates a share or percentage, such as the fraction of people who answered yes. They use different standard errors because the underlying data types are different.
How much does doubling the sample size change the confidence interval?
It narrows the interval, but not by half. Margin of error shrinks with the square root of n, so doubling the sample size reduces the margin by about 29%, while quadrupling the sample size gets you close to halving it. That is why the page now shows precision-planning rows for larger sample sizes.
Why show a Wilson interval if the main result is Wald?
Because Wilson intervals are usually more reliable when sample sizes are small or the observed proportion is close to 0% or 100%. The Wald interval remains a common teaching formula, but the Wilson comparison helps you see when the introductory method may be giving a less stable answer than a more robust alternative.
Guides
Featured in articles
Step-by-step guides that use this calculator to solve real problems.