Skip to content
Calcipedia
Child Teen BMI Calculator instructional illustration

Child Teen BMI Calculator

Calculate BMI-for-age for children and teenagers using CDC growth-chart percentiles, then review the 5th, 50th, 85th, and 95th cut-offs.

Health estimate

Topic review: Elena Vasquez

Fitness Coach & Wellness Writer. Assigned as the health topic reviewer for fitness, energy-expenditure, and body-composition calculators.

Reviewed 17 April 2026 Updated 17 April 2026 View reviewer profile Contact editorial team
BMI-for-age calculator for children and teenagers Use this child and teen BMI calculator to screen ages 2 to 19 against CDC growth-chart percentiles, review the healthy-weight band at the same height, and see how exact chart age changes the interpretation.

Why this is not adult BMI

Child BMI has to be read against age- and sex-specific percentile curves. The same BMI value can map to a different percentile when the child is a year younger or older on the chart, which is why exact date of birth and measurement date matter here.

Quick examples

Units

Sex on growth chart

Use percentile as screening context

Trend matters most: a steady growth pattern often matters more than one isolated reading.

Exact age matters: near-threshold results can move when you change the birth date or assessment date by only a few months.

Under age 2 is different: infants are usually assessed with weight-for-length rather than BMI-for-age.

BMI-for-age result

54th percentile

BMI-for-age for a 10 years old boy using the CDC 2-to-20-year growth charts.

16.8

BMI

Healthy weight

Category

Not applicable

Obesity class

76%

% of 95th percentile

10 years

Exact chart age

Healthy weight BMI-for-age is between the 5th and 85th percentiles on the CDC growth charts, which is the usual healthy-weight screening range for children and teenagers.

50th-percentile weight

31.66 kg

This is the middle of the CDC chart for the same age, sex, and height.

Healthy-band midpoint

31.96 kg

This sits halfway between the 5th- and 85th-percentile weights at the same height.

Gap to midpoint

0.04 kg

The current weight is almost exactly at the healthy-band midpoint.

Same-height threshold sheet

BandBMIWeightCurrent comparisonMeaning
5th percentile14.2127.05 kg4.9 kg aboveBelow this line, CDC screening shifts into underweight.
50th percentile16.6231.66 kg0.3 kg aboveThis is the middle of the CDC chart for the same age and sex.
85th percentile19.3636.86 kg4.9 kg belowAt this line, CDC screening shifts into overweight.
95th percentile22.1142.1 kg10.1 kg belowAt this line, CDC screening shifts into obesity.
120% of 95th26.5350.52 kg18.5 kg belowThis is the usual class II / severe-obesity screening threshold.
Healthy-weight range at this height 27.05 kg to 36.86 kg. The current weight sits inside the CDC healthy-weight screening band.

Same child, different chart age

With the same height and weight, the percentile label shifts from 63rd percentile to 43rd percentile across the age checkpoints shown here.

ScenarioChart agePercentileCategory% of 95th
Same child one year younger9 years63rd percentileHealthy weight79.85%
Current chart age10 years54th percentileHealthy weight76%
Same child one year older11 years43rd percentileHealthy weight72.53%
Near-threshold interpretation This result is inside the healthy-weight band and sits about 4.9 kg from the nearer 85th-percentile line at the same height.

CDC thresholds used here

Healthy weight spans the 5th to under-85th percentiles. Overweight begins at the 85th percentile, obesity begins at the 95th percentile, and class II obesity screening usually begins at 120% of the 95th percentile or BMI 35 kg/m².

How to use this result Percentile describes where the BMI sits relative to children of the same age and sex. Use the percentile, the same-height threshold sheet, the age-sensitivity table, and the child’s growth trend together rather than relying on a single number alone.
← All Body Metrics calculators

Paediatric Growth

Child and teen BMI calculator guide: CDC percentiles, categories, and when to get help

A child and teen BMI calculator does not use the same fixed cutoffs as an adult BMI tool. This page also explains the main assumptions behind the child and teen bmi calculator result, highlights the supporting figures shown by the calculator, and helps the reader use the estimate without overstating what a quick online tool can prove.

Why adult BMI bands do not work for children

Adult BMI uses fixed category cutoffs because adult growth has stabilised. In children and teenagers, the same BMI value can mean something very different at age 4, 10, or 17, and the expected range also differs between boys and girls. That is why paediatric BMI is a screening measure based on BMI-for-age percentile, not a direct diagnosis.

The most useful question is not only “what is the BMI?” but “where does this BMI sit on the growth chart for this child’s age and sex?” A percentile result helps clinicians judge whether the measurement falls below, within, or above the usual range for peers.

How the CDC percentile method works

The calculator first converts the height and weight into BMI, then matches that BMI to the CDC 2-to-20-year reference data for the selected sex and exact age in months. It also reports the 5th, 85th, and 95th percentile thresholds and the percentage of the 95th percentile, which is useful when the result is above the obesity threshold.

For very high BMI values, the CDC program uses an extended approach above the 95th percentile instead of leaving every higher value flattened near the same top percentile. That gives a more informative result when a child or teen is well above the usual obesity cutoff.

BMI = weight (kg) / height (m)^2

Basic BMI is calculated first from height and weight.

% of 95th percentile = (child BMI / BMI at 95th percentile) x 100

Used to describe how far a BMI is above the standard obesity threshold.

Worked example

Suppose a 10-year-old girl measures 138 cm and 32 kg on the assessment date. Her BMI is about 16.8 kg/m². On the CDC growth charts, that sits around the middle of the healthy-weight range rather than near the underweight or overweight thresholds.

Now imagine a 13-year-old at the same height but a much higher weight. The BMI number alone still is not enough. The growth-chart comparison shows whether the result is above the 85th percentile, above the 95th percentile, or high enough to meet the severe-obesity definition based on 120% of the 95th percentile.

How to interpret the categories safely

CDC categories are underweight below the 5th percentile, healthy weight from the 5th percentile to below the 85th, overweight from the 85th to below the 95th, and obesity at or above the 95th percentile. Severe obesity is commonly described as 120% of the 95th percentile or a BMI of 35 kg/m² or higher.

Those labels still need context. Puberty stage, medical history, blood pressure, medications, family history, and the child’s growth trend over time can all matter more than a single measurement. Any underweight, obesity, or severe-obesity result should be reviewed with a paediatric healthcare professional rather than handled as a stand-alone conclusion.

  • This tool is for ages 2 to 19 years only.
  • A single BMI-for-age result is a screening flag, not a diagnosis.
  • Growth trend over time is often more important than one isolated value.
  • Children under 2 years need weight-for-length assessment instead of BMI-for-age.

How to read the percentile result

Percentiles compare a child’s BMI with peers of the same age and sex. A result near the middle of the chart usually means the BMI sits close to the expected range for age, while results near the 5th, 85th, or 95th percentile mark the standard CDC screening boundaries.

When a BMI is above the 95th percentile, the percentage of the 95th percentile helps show how far above the obesity cut-off the result sits. That extra context is useful because two children can both be above the 95th percentile while one is only slightly above it and another is much further beyond the screening line.

Why exact age in months can change the answer

Paediatric BMI-for-age is not only sensitive to the BMI number itself. It is also sensitive to the exact age used on the growth chart. A child measured shortly before a birthday can land on a different percentile than the same child measured shortly after it, even when height and weight have not changed much.

That is why the most reliable workflow uses a real date of birth and a real measurement date instead of estimating age in whole years. Borderline results near the 5th, 85th, or 95th percentile can move enough to change the screening category if the chart age is rounded too loosely.

How obesity class I, II, and III fit into paediatric screening

Once BMI-for-age is at or above the 95th percentile, the standard percentile label becomes less descriptive by itself. Many clinicians then use percentage of the 95th percentile to describe severity. A BMI that is 95th percentile or higher but still below 120% of the 95th percentile is commonly described as class I paediatric obesity.

A BMI at 120% of the 95th percentile or BMI 35 kg/m² is commonly described as class II paediatric obesity, and a BMI at 140% of the 95th percentile or BMI 40 kg/m² is commonly described as class III paediatric obesity. Those are still screening labels, but they help show why two results both labelled “99th percentile” may not represent the same level of clinical concern.

What a near-threshold result means

Many families want to know how close a child is to the next screening line rather than only seeing the headline percentile. Looking at the same-height weights for the 5th, 85th, and 95th percentiles answers a more practical question: how far is the current weight from the underweight, overweight, or obesity screen at the child’s present height?

That same-height sheet is especially useful when a result is near the edges of the healthy-weight band. It helps explain whether a result is comfortably inside the band, close to the overweight screen, or just above the obesity threshold and therefore better interpreted with the percentage-of-95th context.

When the BMI-for-age result needs extra context

A child who is athletic, later in puberty, or naturally larger-framed can show a high BMI-for-age percentile without the same risk profile as a sedentary child with the same number. That is why paediatric BMI should be read beside growth trend, activity level, and the rest of the clinical picture rather than on its own.

The same caution works in the other direction as well. A child with a low BMI-for-age percentile may need review for undernutrition, rapid growth, or other medical issues even if the absolute BMI number does not look dramatic on an adult-style scale.

What to do next if the result is low or high

If the result is below the healthy-weight band or above the 95th percentile, repeat the measurement carefully and look at the pattern over time before drawing conclusions from a single day. A growth chart trend is often more informative than a single BMI-for-age reading.

If the screening result stays outside the healthy-weight band, it is sensible to discuss it with a paediatric healthcare professional, especially if there are symptoms, a sudden change in growth, or concerns about eating, puberty, or medications.

Frequently asked questions

What age range is this calculator for?

It is designed for ages 2 years up to, but not including, 20 years. That matches the CDC child and teen growth-chart reference set. Children younger than 2 years are usually assessed with weight-for-length rather than BMI-for-age.

Does a high percentile mean a child is unhealthy?

Not by itself. A high BMI-for-age percentile is a screening result that should be interpreted alongside growth trend, puberty stage, family history, blood pressure, diet, activity, and medical history. It tells you the child should be assessed in context, not that a diagnosis has already been made.

Why does the calculator show percent of the 95th percentile?

Percent of the 95th percentile is useful when a BMI is already above the obesity cutoff. It helps describe how far above the threshold the result sits and is part of the CDC approach for higher BMI values, where plain percentile labels become less informative.

Should I use this for sports-active or muscular teenagers?

Use it carefully. BMI still does not distinguish lean mass from fat mass, even in paediatric growth charts. Athletic teenagers can have a higher BMI because of muscle, so the result should be interpreted alongside body build, puberty, and clinical assessment.

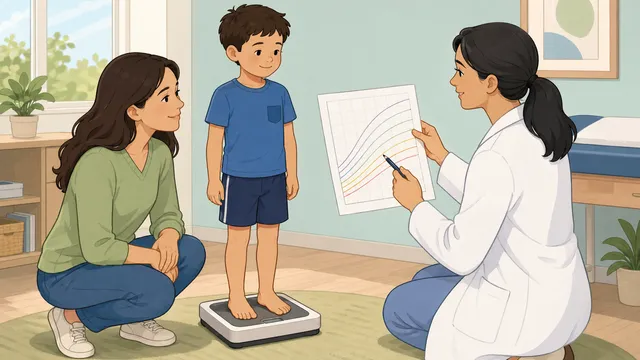
What does the 95th percentile mean?

The 95th percentile is the CDC obesity screening cut-off for BMI-for-age. A child at the 95th percentile has a BMI greater than or equal to 95% of peers of the same age and sex in the reference population. It is a screening line, not a diagnosis by itself.

What is severe obesity on the CDC scale?

Severe obesity is commonly defined as 120% of the 95th percentile or, in some contexts, BMI 35 kg/m² and above. This calculator reports the same-height threshold sheet and the percent of the 95th percentile so that higher results are easier to interpret.

Is this the same as adult BMI?

No. Adult BMI uses fixed cut-offs, but child and teen BMI has to be read against age- and sex-specific percentile curves because growth changes the interpretation. The same BMI value can mean very different things in a 7-year-old and a 17-year-old.

How often should BMI-for-age be checked?

For most families, BMI-for-age is most useful when it is checked as part of routine growth monitoring rather than every day or every week. The trend over time matters more than any single reading, and paediatric clinics usually interpret it alongside height and weight changes.

Why can the percentile change when the height and weight stay the same?

Because the CDC chart compares BMI with children of the same exact age and sex. A child who is measured a few months later moves to a different point on the curve, so the same BMI can map to a different percentile even if the body measurements have not changed much.

What if the result is close to the 85th or 95th percentile?

A near-threshold result is a good reason to check dates and measurements carefully rather than overreacting to one reading. Small changes in height, weight, or chart age can move a borderline result, so the same-height threshold sheet and repeated measurements over time are more useful than a single label.

What is class I, II, or III paediatric obesity?

These are severity descriptions used after BMI-for-age is already at or above the 95th percentile. Class I usually means the BMI is above the 95th percentile but below 120% of it. Class II commonly means 120% of the 95th percentile or BMI 35 kg/m², and class III commonly means 140% of the 95th percentile or BMI 40 kg/m².

Should I worry if the result says 99th percentile?

A 99th-percentile result should not be ignored, but it still needs clinical context. The more useful next questions are how far above the 95th percentile the BMI sits, whether the growth trend has changed, and whether there are symptoms or health concerns that need medical review.

Why might a clinic result differ from my home calculation?

Differences often come from more accurate height measurement, slightly different dates, or different rounding. In children and teenagers, even a small change in height or exact age can shift the percentile enough to make the category look different.

Is this valid for children younger than 2 years?

No. Children younger than 2 years are usually screened with weight-for-length rather than BMI-for-age, so this calculator is intentionally limited to ages 2 years up to, but not including, 20 years.

Can puberty change how BMI-for-age should be interpreted?

Yes. Puberty changes height velocity, body composition, and timing of growth spurts. That does not make the BMI-for-age result useless, but it does mean a paediatric clinician may interpret the same percentile differently depending on puberty stage and growth trend.

Guides

Featured in articles

Step-by-step guides that use this calculator to solve real problems.

Also in Body Metrics

Related

More from nearby categories

These related calculators come from the same leaf category, nearby sibling categories, or the same top-level topic.